
Building Material Cost Trends in Kenya
Key Takeaways
- The Kenyan construction market is projected to expand to a valuation of KES 1.02 trillion by the end of 2026, advancing at a moderated annual growth rate of 7.5%.
- Direct material expenditures comprise 50% to 60% of total project costs, marked by highly volatile steel pricing and targeted ex-factory cement hikes in early 2026.
- Significant geographical variances establish a premium baseline in Nairobi of up to KES 90,000 per square metre, whereas rural regions drop to KES 40,000 per square metre due to localized labor dynamics.
- Systemic cost stabilization throughout 2025 and 2026 is directly tied to a predictable supply chain, a stable currency exchange, and aggressive monetary policy easing by the Central Bank of Kenya.
Baseline Cost Distributions and Inflationary Trajectories
The Kenyan construction sector during the 2025–2026 cycle reflects structured stabilization following intense market expansion between 2021 and 2025. By the end of 2026, the aggregate market value is scheduled to hit KES 1.02 trillion, a 7.5% year-on-year elevation driven by demographic urbanization, statutory affordable housing mandates, and improving macroeconomic metrics. Averaged baseline execution costs across the country for 2025 sit between KES 40,000 and KES 75,000 per square metre. Disaggregated by asset classification, low-cost residential construction commands KES 40,000 to KES 50,000 per square metre, middle-class housing spans KES 55,000 to KES 65,000 per square metre, high-end residential configurations demand KES 70,000 to KES 90,000 per square metre, and commercial office blocks require KES 70,000 to KES 100,000 per square metre. Sector-specific inflation decelerated sharply relative to the aggressive cycles of 2024, opening at a minimal annualized rate of 0.18% in Q1 2025 before executing a marginal adjustment upward to close at 0.62% by Q4 2025.
Material Commodity Price Movements
Material procurement exerts a critical influence on financial exposure, systematically driving 50% to 60% of total project costs. Retail pricing for a standard 50kg bag of cement hovered between KES 650 and KES 850 throughout 2025. However, following structural fluctuations in the underlying index, early 2026 experienced renewed upward pressure, culminating in the East Africa Portland Cement Company executing a 1.39% increase on ex-factory prices for Blue Triangle cement in March 2026 to cover escalating raw material inputs. Steel reinforcement bars (rebars) sustained high volatility, trading within a broad band of KES 95,000 to KES 120,000 per ton in 2025; localized unit costs registered at KES 450 to KES 700 for D8 bars and KES 4,400 to KES 4,4600 for D25 bars. Conversely, timber and wood indices experienced contractions, retrenching by 2.71% in Q3 2025 and an additional 1.63% in Q4 2025, with Cypress (2×2) maintaining unit pricing of KES 25 to KES 35 per foot. Auxiliary components such as gauge 30 roofing sheets traded between KES 600 and KES 1,200 per metre, while standard 6×9 machine-cut stones balanced at KES 20 to KES 30 per piece.
Geographical Cost Variations and Regional Premiums
Asset deployment costs demonstrate sharp regional variations across the Kenyan landscape, dictated primarily by urban demand, premium finish requirements, and labor market localized conditions. A pronounced structural premium persists in Nairobi, pushing baseline developmental costs to a bracket of KES 60,000 to KES 90,000 per square metre, fueled by intense land valuation metrics and rigorous procurement specifications. The Coast Region follows with a slightly lower operational band, averaging between KES 55,000 and KES 80,000 per square metre. Western and Nyanza Regions recorded distinct upward cost pressure over the 2025 fiscal year, concluding with standard residential bungalow metrics averaging KES 57,080 per square metre. Rural areas present the lowest financial barrier, indexing at KES 40,000 to KES 55,000 per square metre, an optimized cost profile achieved primarily through substantially more affordable local labor markets.
Macroeconomic Catalysts and Multi-Year Projections
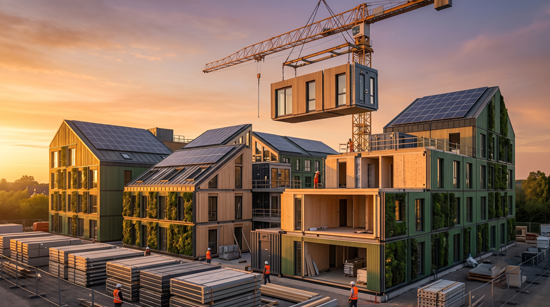
The equilibrium established in construction expenditures through 2025 and early 2026 remains fundamentally underpinned by supply chain predictability and monetary stabilization. The Kenyan Shilling stabilized effectively against the US Dollar, anchoring close to KES 129 in early 2026. Concurrently, the Central Bank of Kenya implemented a decisive monetary easing cycle, rolling back the Central Bank Rate (CBR) from its late 2023 high of 12.5% down to 8.75% by April 2026, an intervention explicitly calibrated to unlock private sector commercial lending for capital infrastructure projects. Long-term forecasting positions the sector for a steady, predictable annualized growth rate of 5% to 8% beyond 2025. Between 2026 and 2030, the market is structurally modeled to advance at a Compound Annual Growth Rate (CAGR) of 6.4%, expanding the sector’s net valuation to KES 1.41 trillion by the close of the decade. Major technical margins within this projection are expected to come from green building methods and prefabricated component assembly, technologies proven to shrink project delivery schedules and total capital expenditure by up to 30%.
Conclusion
The technical management of construction expenditure in Kenya requires a deep understanding of stabilizing yet volatile macroeconomic and commodity indicators. As the market transitions into a mature growth curve characterized by a projected KES 1.41 trillion valuation by 2030, the capacity to offset regional premiums and baseline raw material hikes through alternative methods like prefabrication will dictate corporate margins and overall project viability.